

tool Details
Explore More
Alternatives
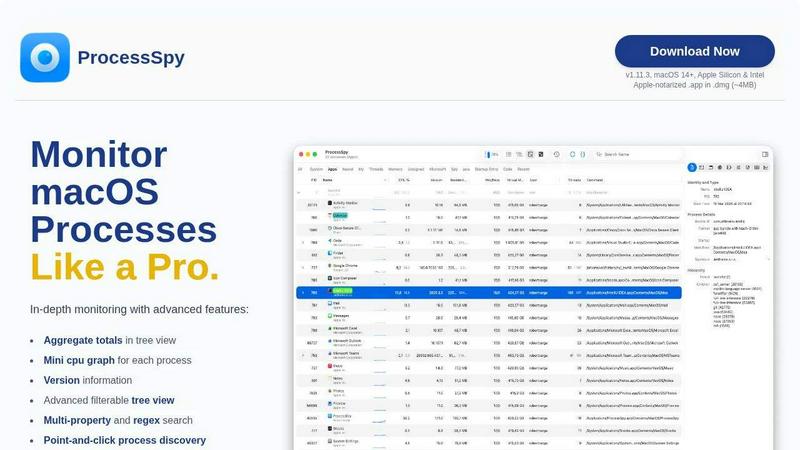
About ProcessSpy
Tired of macOS Activity Monitor leaving you in the dark? Welcome to ProcessSpy, the ultimate native process explorer built exclusively for macOS! This powerful tool is your backstage pass to everything happening on your Mac, revealing the hidden details that the standard tools keep secret. Designed for developers, power users, and IT professionals, ProcessSpy transforms vague process lists into a crystal-clear, actionable dashboard. Visualize intricate process trees, inspect every open file and network connection, and view critical environment variables with ease. Need to terminate a stubborn, frozen application? Do it instantly and decisively! Built with native macOS APIs for blistering performance and a seamless, Mac-first experience, ProcessSpy is the definitive alternative to Sysinternals Process Explorer for the Apple ecosystem. Stop guessing and start knowing exactly what's running on your machine!
Features
Advanced Hierarchical Process Tree
Dive deep into your system's activity with a dynamic, filterable process tree view! This isn't just a simple list; it visually maps parent-child relationships so you can see exactly which process spawned another. The real magic? It displays live aggregate totals for CPU, memory, and thread usage for entire branches of the tree, giving you an instant overview of which application families are consuming your resources. Combine this with powerful filtering to cut through the noise and focus on what matters!
Powerful Multi-Property & Regex Search
Find any process in a flash with our incredibly flexible search system! Go beyond simple name matching. Search across multiple properties simultaneously using regular expressions for pinpoint accuracy. Looking for a Java process with a specific command-line argument like "-Xmx1024m"? You can do that! This feature turns tedious hunting into a quick, precise operation, saving you valuable time when debugging or monitoring complex software environments.
JavaScript-Powered Custom Filters
Unleash total control over your process view with advanced JavaScript filters! Create complex, multi-condition logic to display exactly the processes you want to see. Filter by CPU usage thresholds, memory consumption, user, start time, or any other visible property. This programmability makes ProcessSpy adaptable to any unique workflow or troubleshooting scenario, offering a level of customization unmatched by other system monitors.
Comprehensive Process Context & Inspection
Right-click on any process to unlock a world of information and actions! Instantly see version details and bundle information right in the main table. The context menu lets you inspect open files, active network connections, and loaded dynamic libraries (dylibs). For licensed users, this expands to reveal deep system insights like environment variables, code entitlements, the full Info.plist, and signature details. It's like having a forensic toolkit at your fingertips!
Use Cases
Debugging and Development Workflows
Are you a developer juggling multiple runtime instances, like several Java apps on different JDK versions? ProcessSpy is your savior! It cuts through the ambiguity of "java" processes by showing you the full command-line path, version information, and environment variables. Quickly identify which process belongs to which project, check resource usage, and kill misbehaving instances without restarting your entire IDE or test suite!
System Performance Analysis and Optimization
Is your Mac running slow or a fan spinning wildly? ProcessSpy helps you diagnose the culprit! Use the hierarchical tree with aggregate totals to instantly see which application family is hogging CPU or memory. The mini CPU graphs per process provide a quick visual history. Pinpoint resource leaks, identify background processes gone wild, and make informed decisions about what to quit or investigate further.
Security and Privacy Auditing
Wonder what that unknown process is doing on your Mac? ProcessSpy empowers you to investigate! Inspect all open files and network connections for any process to see what it's accessing. Licensed users can delve deeper, checking code signatures, entitlements (what system permissions an app has), and launch agents. This is invaluable for verifying software behavior and ensuring no unwanted programs are snooping on your data.
IT and Advanced User System Administration
Manage and troubleshoot macOS systems like a pro! Use ProcessSpy to document running services, view the complete launch context of daemons and agents, and gracefully terminate unresponsive system processes. The ability to remember finished processes (a paid feature) is perfect for post-mortem analysis after an application crash, allowing you to review its arguments and environment later.
Frequently Asked Questions
Is ProcessSpy safe to install on my Mac?
Absolutely! ProcessSpy is completely safe and trustworthy. It is Apple-notarized, meaning Apple has scanned it for malicious content. It's distributed as a signed .app inside a .dmg file, ensuring its integrity. It runs natively and efficiently on both Intel and Apple Silicon Macs without any bloated cross-platform layers.
What macOS versions are supported?
ProcessSpy is designed for modern macOS systems. It supports macOS 14 Sonoma and newer, including the latest versions. It leverages native APIs for the best performance and integration, so it focuses on compatibility with current and future Apple operating systems.
What is the license model and what do I get?
The license is a fantastic value! For a one-time payment, you get a lifetime license for one user across unlimited personal devices, which includes all future updates and new features. This unlocks the powerful paid features like viewing environment variables, process history recording, CSV export, and the ability to remember finished processes for deep analysis.
How does ProcessSpy compare to the built-in Activity Monitor?
Activity Monitor is a basic tool, while ProcessSpy is a professional-grade explorer! ProcessSpy shows the full command line and path, distinguishes between identical process names using version info, displays aggregate resource totals in the tree, and offers regex search. Paid features extend this lead massively with historical data, entitlement views, and forensic details that Activity Monitor simply doesn't provide.
Similar to ProcessSpy

Nijia
Understand your Mac's storage, review cleanup candidates, and organize files with control.

SightRadar
Face recognition API, a drop-in replacement for AWS Rekognition. Index, search, compare and detect faces, billed per photo with no subscription.

ButterShare
ButterShare is a browser-based peer-to-peer file transfer tool that lets you send large files and folders directly between devices without signup or c

Enlisted
Search 20,000+ open-source and SaaS tools by the job you need done or the app you want to replace.

Egmatic
No-code 2D game editor: visual node logic, drag-and-drop scenes, live preview. Exports to Windows, macOS, Linux, Android, iOS, Web.

layahost
Moderation, routing, intent and scoring for any text over one Jev-compatible API, hosted in the EU.

laya.tools
Free directory of 950+ projects built on Laya, the open-source model that turns text into typed decisions in milliseconds.

Forms Plugin
The #1 Native Form Builder Plugin for Framer - No Code, No Embeds, No External Platforms.