

tool Details
Explore More
Alternatives

About Chart Echo
Chart Echo is a revolutionary market research tool that finally answers the question every trader and investor has asked: "Has this chart pattern happened before, and what happened next?" By searching through a massive database of roughly 450 million historical windows across stocks and cryptocurrencies, Chart Echo instantly finds the closest matches to the exact chart pattern you are watching right now! Forget spending hours scrolling through decades of charts manually. This powerful tool does the heavy lifting for you, overlaying those historical matches directly onto your current setup in gold so you can see the similarities with your own eyes. But it does not stop there! Chart Echo goes beyond simple pattern recognition by aggregating the future outcomes of all those historical matches, giving you honest, data-grounded statistics on how often setups like yours rose, fell, or went sideways. It shows you the average move, the typical drawdown, and the real odds, all based on the market's own memory. Chart Echo is built for active traders looking for an edge, long-term investors wanting to sanity-check a breakout, and crypto watchers who know that digital assets rhyme hard with their own past. It is not a prediction or financial advice. It is pure, organized precedent that empowers you to make more informed decisions with confidence and clarity. Best of all, you can try it for free with no signup required!
Features
Massive Historical Pattern Database
Chart Echo searches through an incredible library of roughly 450 million historical windows across stocks and cryptocurrencies to find your exact match! This massive dataset means you are not just looking at a few similar patterns. You are getting a statistically significant sample of how the market has behaved in the past under almost identical conditions. Every search pulls from a deep well of market memory, giving you the most comprehensive precedent analysis available anywhere!
Gold Overlay Visualization
See the past come to life on your current chart with the stunning gold overlay feature! When Chart Echo finds a historical match, it does not just give you a list of dates. It dynamically overlays that past pattern directly onto your current setup in a bright, easy-to-read gold line. This visual comparison lets you instantly see the structural similarities and differences, making it incredibly intuitive to understand why a pattern is considered a match and how it might resolve!
Outcome Statistics and Odds
Get the hard numbers that matter most with detailed outcome statistics for every matched pattern! Chart Echo aggregates the future performance of all historical matches and presents you with clear, honest data. You will see the percentage of times the setup rose, fell, or went nowhere after the match point. It also calculates the average move and the typical drawdown along the way, giving you a realistic, data-grounded picture of the probabilities instead of relying on gut feelings or vague market "vibes"!
Guided Five-Step Workflow
Chart Echo simplifies the entire process with a clear, guided five-step workflow that anyone can follow! Start by picking your market, then frame your pattern by setting the timeframe and candle count. Run the search to get a ranked list of historical echoes, each with its own rhyme and strength score. Overlay your chosen match in gold to study the outcome statistics, and finally, act on your insights by saving the workspace, setting a reminder, or sharing a Story GIF. No blank canvas, no guesswork, just a straight path to an answer!
Use Cases
Pre-Trade Setup Analysis for Active Traders
Before you take a single trade, use Chart Echo to see how similar setups have actually performed in the past! Active traders can input their current chart pattern and instantly get a ranked list of the closest historical analogs. This allows you to study the odds, average move, and typical drawdown over the following days or weeks. Instead of relying on a hunch or a single indicator, you can base your decision on concrete precedent from the market's own history, giving you a powerful edge in your trading strategy!
Sanity-Checking Breakouts for Long-Term Investors
Long-term investors can use Chart Echo to sanity-check a major breakout or a sharp sell-off against decades of real market data! Instead of relying on a single pundit's opinion or a headline, you can instantly see how similar structural moves played out in the past. This data-driven perspective helps you frame your decision with the market's own memory, allowing you to distinguish between a genuine trend change and a temporary fluctuation. It is the ultimate tool for keeping emotions in check and making rational, long-term investment choices!
Analyzing Crypto Market Rhythms
Crypto enthusiasts know that this market rhymes hard, and Chart Echo is the perfect tool to prove it! Match Bitcoin, Ethereum, and other major cryptocurrencies against their own past structures or even across different assets. See how a current consolidation pattern in BTC compares to its previous accumulation phases before major rallies. Chart Echo helps you spot where today's crypto chart has happened before, giving you a unique lens to understand the cyclical nature of digital assets and make better-informed decisions in this volatile space!
Sharing and Collaborating on Chart Ideas
Chart Echo makes it incredibly easy to share your analysis with friends, colleagues, or your trading community! The platform allows you to generate and share GIFs and images of your chart setups with the historical gold overlays. You can also get notified when your favorite stock or crypto prints a strong fractal projection. This collaborative feature turns pattern analysis into a social experience, allowing you to discuss ideas, debate probabilities, and learn from each other's findings in real time!
Frequently Asked Questions
Is Chart Echo a prediction tool or financial advice?
No, absolutely not! Chart Echo is strictly a historical pattern matching and research tool. It does not predict the future or provide financial advice. Its purpose is to show you how similar chart patterns have behaved in the past by searching through its massive database of historical windows. The outcome statistics it provides are based purely on historical precedent, not on any predictive model. Always do your own research and consult with a qualified financial advisor before making any investment decisions!
How does Chart Echo find matching chart patterns?
Chart Echo uses a sophisticated fractal matching algorithm to compare the shape of your current chart pattern against its database of roughly 450 million historical windows. It does not rely on traditional technical indicators or scripts. Instead, it analyzes the raw price structure and shape of your chart to find the closest historical analogs. Each match is ranked by how strongly it rhymes with your current setup, and the tool clearly explains why a particular pattern is considered a match!
What markets and timeframes are supported?
Chart Echo currently supports a wide range of stocks and cryptocurrencies. You can search for patterns across these markets using various timeframes and candle counts to define "the pattern" you are analyzing. The free tier provides robust functionality, while the Premium tier unlocks additional features like intraday timeframes, saved-setup reminders, and alerts. The goal is to give you maximum flexibility to analyze the markets you care about most!
Do I need to create an account to use Chart Echo?
No, you can try Chart Echo for free with no signup required! This allows you to experience the core pattern matching and visualization features immediately. If you want to save your workspaces for later review, you can create a free account. For advanced features like Pro Mode, intraday timeframes, alerts, and watermark-free exports, you can upgrade to a Premium plan. The free tier is designed to give you a real taste of the tool's power without any commitment!
Similar to Chart Echo
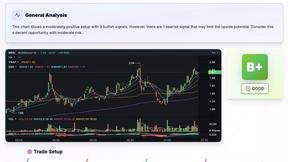
SnapPChart
SnapPChart grades a trading chart screenshot A+ to F, with an entry, stop, targets, and risk/reward. Works on stocks, forex, crypto, futures.

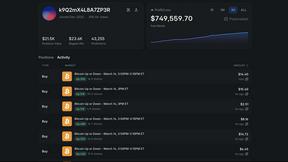
Polymarket Trading Bot For Crypto
Automate the exact strategy that turned $68 into $1.5M on Polymarket with this transparent, 24/7 trading bot for 5-15 minute crypto markets.
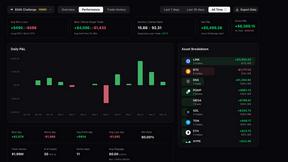
Trading Risk Lab
Take control of your trading with Trading Risk Lab, the ultimate toolkit for precise risk management and smart position planning!.
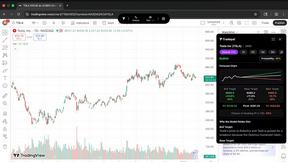
Tradepal
Unlock powerful AI-driven stock analysis that delivers real-time insights and forecasts right from your screenshots!.
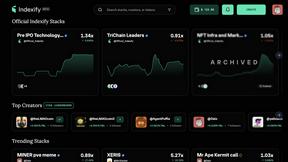
Indexify
Follow expert crypto strategies and own their portfolios on Solana with Indexify.
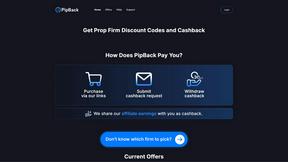
PipBack
PipBack helps prop traders save big with exclusive discounts and real cashback on tools and challenges!.