Dividend Data vs MonsterOps
Side-by-side comparison to help you choose the right tool.
Dividend Data
Instantly pull dividends, prices, and 30+ years of stock data directly into your Google Sheets or Excel!.
Last updated: March 11, 2026
MonsterOps
MonsterOps is your ultimate business OS for seamless strategy alignment and execution clarity!.
Last updated: March 1, 2026
Visual Comparison
Dividend Data

MonsterOps
Feature Comparison
Dividend Data
Instant Spreadsheet Automation
Say goodbye to manual data entry forever! Dividend Data integrates seamlessly with Google Sheets and Excel, providing over 16 custom functions that pull live data directly into your cells. Just type a formula like =DIVIDENDDATA_QUOTE("AAPL", "price") and the current stock price appears. Automate dividends, financial ratios, historical prices, and more, ensuring your investment models and trackers are always up-to-date with zero effort on your part!
Comprehensive Dividend & Fundamental Data
Access everything a serious investor needs in one place! This feature delivers deep, reliable data including forward dividends, yields, ex-dividend dates, payout ratios, and dividend growth rates. Beyond dividends, get full financial statements (income, balance sheet, cash flow), key valuation and profitability ratios (P/E, P/B, ROE), and 100+ other metrics. With 30+ years of history for 80,000+ tickers, you have a complete fundamental analysis toolkit at your fingertips!
Generous Free Tier with No Expiration
Start analyzing like a pro without spending a dime! Dividend Data offers a truly free-forever plan that gives you 2,500 credits every single month, with no trial period and no credit card required. This allows you to test dozens of formulas and build powerful spreadsheets at no cost. It's the perfect way to experience the power of automated data before deciding to upgrade for even higher volume needs!
Dual Platform Compatibility (Sheets & Excel)
Work the way you want, where you want! Dividend Data is uniquely built to function flawlessly in both Google Sheets and Microsoft Excel environments. Whether your team uses the cloud-based collaboration of Sheets or the advanced analytical power of desktop Excel, you get the same simple formulas and reliable data. This flexibility ensures every investor can integrate live market data into their preferred workflow without compromise!
MonsterOps
Centralized Workspace
MonsterOps provides a singular, comprehensive workspace that integrates all your business processes. Say goodbye to scattered tools and hello to streamlined operations! This central hub ensures that everyone on your team is aligned and informed, enhancing collaboration and productivity.
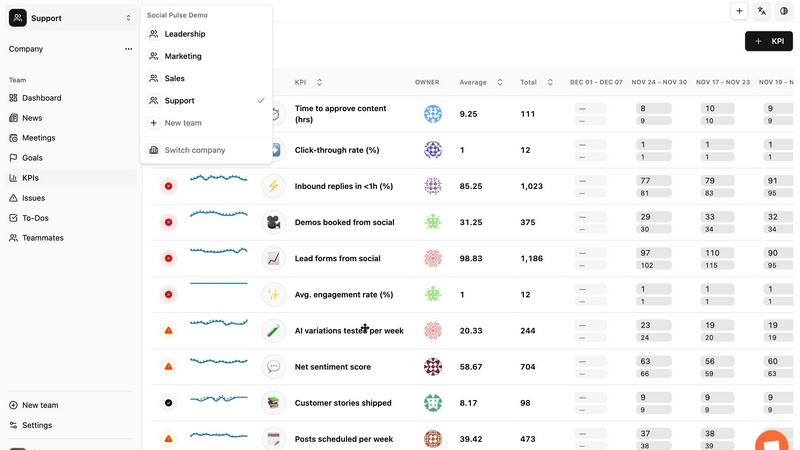
Live KPI Scorecards
Get real-time visibility into your business health with our live KPI scorecards! Monitor key performance indicators effortlessly, allowing you to make informed decisions and adjustments on the fly. No more guesswork—stay on top of your performance metrics at all times!
Built-in Meeting Agendas
Run hyper-efficient leadership meetings with our built-in agenda feature! Prepare meeting outlines that keep discussions focused and productive. This feature ensures that every goal and challenge is addressed, making your meeting time more valuable and actionable.
Flexible Framework Support
MonsterOps is designed to support proven frameworks like EOS and Scaling Up, while remaining flexible enough to accommodate custom operating playbooks! Tailor the system to fit your unique business needs, ensuring that your operational strategies are executed with precision and predictability.
Use Cases
Dividend Data
Building a Dynamic Dividend Portfolio Tracker
Create a live, automated dashboard of your entire investment portfolio! Use formulas to pull current prices, dividend yields, and annual income for each holding. Track your total portfolio value, overall yield, and projected dividend income that updates automatically with market changes, saving you hours of manual updating every month and giving you a real-time view of your financial progress!
Conducting In-Depth Stock Screening & Analysis
Screen for the perfect dividend stocks based on your specific criteria! Quickly pull payout ratios, debt levels, earnings growth, and PE ratios for thousands of stocks into a single sheet. Build custom screens to find companies with a history of dividend growth, strong financial health, and attractive valuations, all without leaving your spreadsheet and manually looking up each metric!
Preparing Investment Reports and Models
Impress clients or inform your own decisions with professionally backed data! Seamlessly integrate historical dividend data, financial ratios, and price history directly into your valuation models (like DCF) and investment thesis reports. Ensure every number is accurate and sourced from a reliable database, making your analysis more credible and robust with minimal manual data gathering!
Monitoring Dividend Safety and Key Dates
Never miss a critical date or a warning sign again! Set up a watchlist sheet that uses formulas to display the next ex-dividend and payment dates for all your holdings. Simultaneously, monitor key safety metrics like payout ratios and earnings coverage, which can alert you to potential dividend cuts, helping you manage risk and plan your cash flow effectively!
MonsterOps
Streamlining Team Collaboration
Imagine a platform where every team member can access the same information, track progress, and collaborate seamlessly. MonsterOps creates a unified environment where communication flows freely, reducing misunderstandings and enhancing teamwork across departments.
Efficient Goal Tracking
With MonsterOps, tracking goals is a breeze! Set clear objectives and monitor their progress in real-time. This capability ensures that you stay aligned with your business strategy and can quickly pivot when challenges arise, keeping your team focused on achieving results.
Enhancing Business Visibility
Gain unparalleled insight into your business operations with live KPI scorecards! This feature allows you to visualize data and trends, helping you identify areas for improvement and make data-driven decisions that propel your business forward.
Conducting Productive Leadership Meetings
Transform your leadership meetings from chaotic to productive with MonsterOps' built-in agenda system! Ensure that every meeting is focused and actionable, addressing all key points and maintaining engagement among team members, ultimately leading to better decision-making.
Overview
About Dividend Data
Tired of jumping between websites, copying data, and manually updating your spreadsheets? Meet Dividend Data, the revolutionary tool that brings institutional-grade stock market intelligence directly into your favorite spreadsheet! Built by a dividend investor for dividend investors, this powerful add-in for Google Sheets and Microsoft Excel eliminates the tedious work. Just type a simple custom formula like =DIVIDENDDATA_DIVIDENDS("MSFT") and watch over 30 years of historical data for 80,000+ tickers appear instantly. No API keys, no complex coding, and absolutely no more copy-pasting! It's designed for fundamental and dividend-focused investors who need reliable data on dividends, yields, payout ratios, financial statements, earnings, and 100+ other key metrics. With a generous free tier offering 2,500 monthly credits that never expire, you can start automating your analysis today without any risk. Get the data you need to make smarter investment decisions, all within the familiar, powerful environment of your spreadsheet. Transform your workflow from manual to magical with Dividend Data!
About MonsterOps
Welcome to MonsterOps, the revolutionary all-in-one Business Operating System (BOS) crafted specifically for small to mid-sized businesses! Are you tired of the chaos that comes with managing multiple spreadsheets, documents, and task apps? MonsterOps is here to bring clarity and cohesion to your operations! This powerful workspace consolidates your entire business into one platform, allowing for seamless workflow and enhanced collaboration among team members. Whether your company is implementing frameworks like the Entrepreneurial Operating System (EOS) or Scaling Up, or if you have a tailor-made operating playbook, MonsterOps adapts to your needs! With real-time visibility into business health via live KPI scorecards, you can monitor your progress effortlessly. Plus, our built-in agenda feature helps you run hyper-efficient leadership meetings, ensuring that every goal, challenge, and to-do is tracked in a shared source of truth. Designed for founders and leadership teams ready to transition from firefighting to strategic leadership, MonsterOps is the command center that empowers your business to grow consistently and with confidence!
Frequently Asked Questions
Dividend Data FAQ
How do I get started with Dividend Data?
Getting started is incredibly easy and free! Simply install the add-in from the Google Workspace Marketplace for Sheets or from Microsoft AppSource for Excel. Once installed, you can immediately start using the custom formulas in your spreadsheets. No API key configuration is needed. Your free account with 2,500 monthly credits is activated automatically, so you can start pulling data within minutes!
What kind of data can I access with the formulas?
You can access a vast array of investment-grade data! This includes dividend-specific info (amount, yield, dates, growth), real-time quotes, over 30 years of historical prices, complete financial statements (income, balance sheet, cash flow), and key fundamental ratios (P/E, P/B, ROA, debt-to-equity). In total, you have access to 100+ metrics across 80,000+ global tickers, all updated regularly!
What are credits and how many do I use?
Credits are the unit used to measure your data usage. Each cell you populate with a Dividend Data formula consumes one credit. For example, if you use a formula to pull the dividend yield for 10 different stocks in 10 different cells, you use 10 credits. The free plan provides 2,500 credits per month, which is ample for building and maintaining several powerful spreadsheets!
Does the data update automatically in my sheet?
Yes, the data is live and updates dynamically! When you open your spreadsheet or refresh it, the Dividend Data formulas will automatically fetch the most recent information available. This ensures your analysis, portfolio trackers, and screens always reflect the latest market prices, financials, and dividend announcements without any manual intervention from you!
MonsterOps FAQ
What type of businesses can benefit from MonsterOps?
MonsterOps is designed specifically for small to mid-sized businesses across various industries. It caters to organizations looking to streamline operations, enhance collaboration, and maintain strategic alignment.
Can MonsterOps integrate with existing tools my business uses?
Yes! MonsterOps is built with flexibility in mind, allowing you to integrate with existing tools and software your business already utilizes. This ensures a smoother transition and maintains continuity in your operations.
How does MonsterOps support different operational frameworks?
MonsterOps is versatile and can support established frameworks like the Entrepreneurial Operating System (EOS) and Scaling Up while also allowing the customization of your unique operating playbook to ensure it fits seamlessly with your business needs.
Is there customer support available with MonsterOps?
Absolutely! MonsterOps offers dedicated customer support to assist you with any questions or challenges you may encounter while using the platform. We are committed to ensuring you have a smooth and efficient experience!
Alternatives
Dividend Data Alternatives
Dividend Data is your all-in-one toolkit for fundamental and dividend investing, bringing over 30 years of stock market data directly into your spreadsheets! It falls into the category of financial data platforms designed for individual investors who demand deep, historical insights without complexity. You might be exploring other options for a few key reasons. Perhaps you need a different pricing model, require specific data points not in your current tool, or need seamless integration with a particular analysis platform. It's smart to shop around! When evaluating your choices, focus on what matters most: the depth and reliability of historical data, the simplicity of getting that data into your workflow, and the overall value for your investment strategy. The right tool should feel like a natural extension of your research process, not a hurdle.
MonsterOps Alternatives
MonsterOps is an all-in-one Business Operating System (BOS) crafted to enhance clarity and streamline operations for small to mid-sized businesses! It centralizes your workflows, goals, and meeting management into a single platform, replacing chaotic spreadsheets and disjointed task apps. Users often seek alternatives to MonsterOps for various reasons, including pricing constraints, feature sets, or specific platform requirements that better suit their unique business needs. When evaluating alternatives, consider factors such as ease of use, integration capabilities, customer support, and the specific functionalities that will best serve your organization’s operational goals.