Parabola

About Parabola
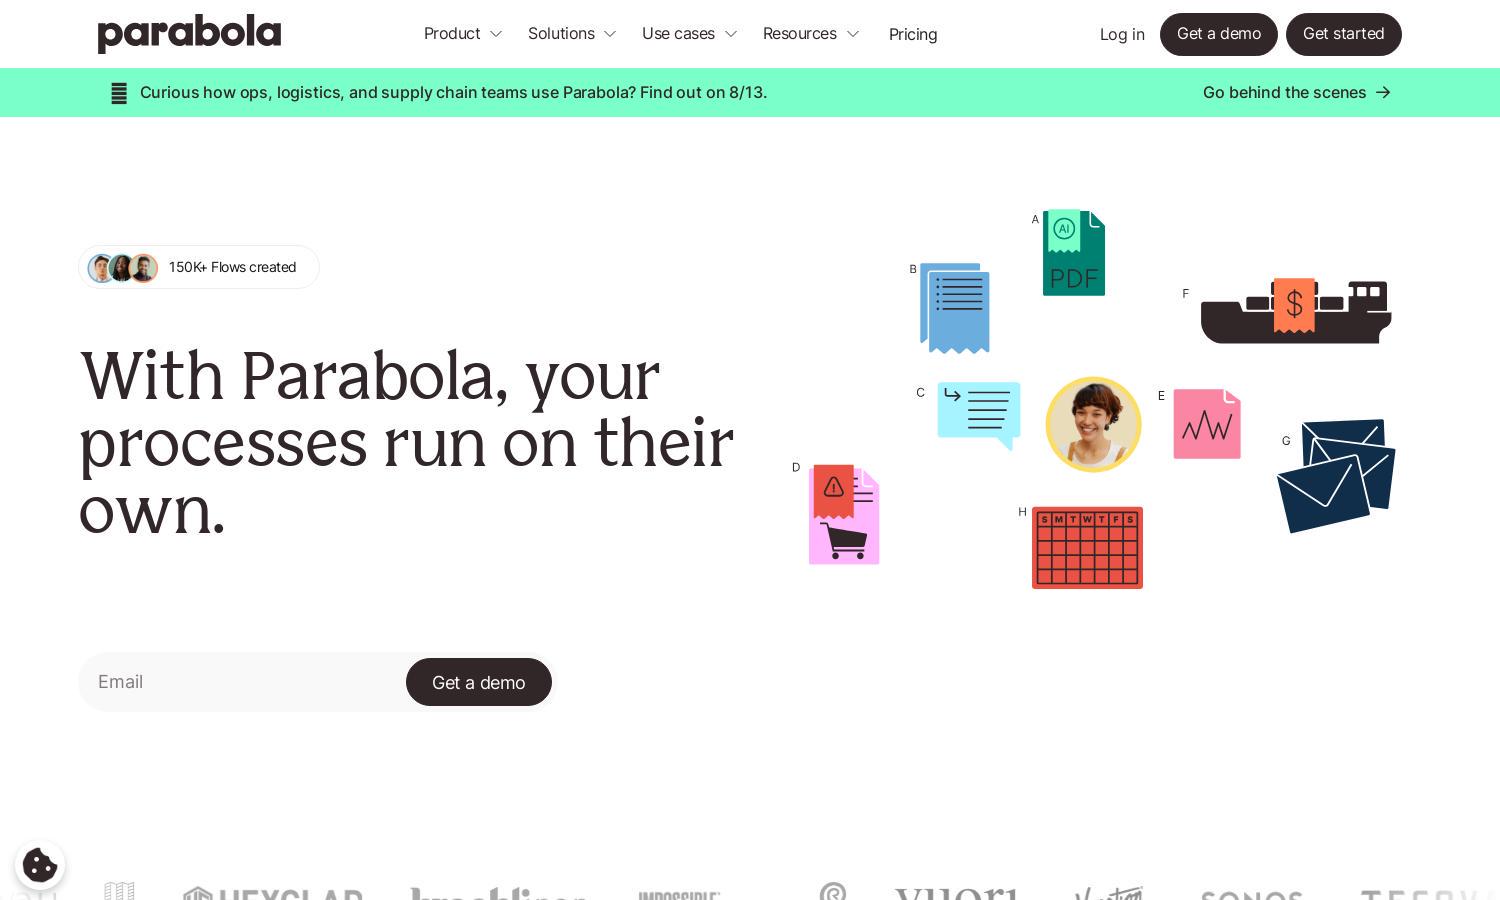
Parabola empowers businesses to automate their data processes effortlessly. By allowing users to import data from multiple sources, transform it with intuitive tools, and export the results, Parabola enhances operational efficiency. Perfect for teams seeking to minimize manual tasks, it revolutionizes workflows for various industries.
Parabola offers flexible pricing plans tailored to different business needs, including a free tier for newcomers. Users can upgrade to unlock advanced features and greater automation capabilities, ensuring they receive enhanced value as their data processing demands grow. Discover economical solutions for optimizing workflows with Parabola.
Parabola's user interface is designed for simplicity, providing a seamless experience for data management. With its intuitive layout, users can easily navigate through features, visualize data, and set up processes without hassle. This user-friendly design ensures that businesses can automate effectively and efficiently.
How Parabola works
Users interact with Parabola by first signing up and selecting a use case that fits their needs. During onboarding, they can import their data from various sources like Excel, APIs, or email. They then leverage Parabola’s intuitive tools to transform and automate processes, generating dynamic outputs ready for export.
Key Features for Parabola
Automated Workflows
Parabola's Automated Workflows feature enables users to streamline their data processes effortlessly. Users can combine data from multiple sources, apply transformations, and automate exports, ensuring efficiency and accuracy, thus reducing manual workload and increasing productivity across teams.
Data Integration
With Parabola's Data Integration feature, users can import data from diverse platforms seamlessly. This capability allows businesses to unify their data, simplifying their analysis and reporting, while enhancing collaboration across departments by ensuring everyone works with the same information.
Dynamic Visualizations
Parabola's Dynamic Visualizations capability allows users to create engaging charts and dashboards from their data effortlessly. These visual outputs make it easier for teams to understand insights at a glance, fostering better decision-making and streamlining communication across stakeholders.
You may also like:


